
Passive Thermal Covers: How Is Temperature Preserved?

A passive thermal cover produces neither cold nor heat. It slows the heat exchange between the goods and the surrounding air, so the product temperature drifts slowly instead of tracking the ambient. What holds the product inside its range is the thermal inertia of the load, protected by an insulating and airtight barrier.

Two recent qualification reports on our MET-Q cover, available on request as part of a commercial proposal, put numbers on this: a summer test (climate chamber at 48.32 °C average air, then direct sunlight exposure) and an extreme winter test (chamber at -12 °C). All figures below come from those reports.

What is a passive thermal cover?

A passive thermal cover is a multilayer insulating envelope fitted over a wrapped pallet, completed by a bottom base, with no energy source and no phase change material. Its only job is to restrict heat flow.

Three direct consequences:

  • It never cools a product that is already out of range. A pallet loaded at 28 °C will stay at 28 °C or climb.
  • Its performance is measured in hold duration, not in target temperature.
  • Its effectiveness depends as much on the goods (mass, starting temperature) as on the material itself.

For available sizes and configurations, see our thermal pallet covers page and the article what is a thermal pallet cover.

Passive or active, in one sentence

Passive slows the drift; active compensates for it. A phase change solution such as Mettcool PCM absorbs or releases energy to hold a setpoint over several days, whereas a passive cover typically targets a few hours to a few tens of hours. The decision follows the real exposure time, not the catalogue.

The three mechanisms a cover restricts

Heat moves by conduction, convection and radiation. An effective cover acts on all three, and the METQ technical specifications show how.

Conduction: thickness and trapped air

Conduction crosses the wall. METQ is 15.16 mm thick, with a density of 52.50 kg/m³ and a thermal resistance (R-value) of 0.3877 m²·K/W, obtained by calculation. The higher the R-value, the lower the flow through the wall for a given temperature difference.

Convection: air tightness

This is the most frequently overlooked point. Even limited air exchange cancels the effect of the insulation, because hot or cold air reaches the cases directly. METQ measures 0.0 cm³/s/cm² air permeability (ASTM D737), and the test protocol systematically pairs the cover with a bottom base to close the volume underneath. A cover left open, or fitted without a base, loses a substantial share of its performance.

Radiation: surface emissivity

On a tarmac, a large part of the thermal load arrives as solar radiation rather than through the air. METQ emissivity is 0.16 (ASTM C1371), so the surface re-emits little and reflects part of the incident flux.

Thermal inertia of the load: the deciding factor

For a given material, hold duration is driven by how much product sits under the cover. A fully loaded water pallet takes far longer to change temperature than a half empty one.

That is why both METQ tests ran at minimum load, as a worst case scenario:

  • Summer test: 8.5 % of the pallet volume, that is 384 water bottles of 250 ml across 12 cases.
  • Winter test: 5.4 % of the volume, that is 7,800 water for injection vials of 10 ml across 12 cases.

A shipper loading a pallet to 60 % will see hold durations well above the published values. Conversely, a nearly empty pallet under a cover protects very little.

Why the curve is never linear

Heat flow is proportional to the temperature difference between product and outside. As the product approaches ambient, that difference shrinks and the drift slows. The progression is asymptotic, not linear.

Winter test readings at the coldest point (bottom left corner, chamber at -12 °C) show it:

Product temperature under a passive thermal cover in a -12 °C chamber
Elapsed time Product temperature Change over the hour
0 h 20.5 °C
1 h 14.6 °C -5.9 °C
2 h 10.1 °C -4.5 °C
3 h 6.9 °C -3.2 °C
4 h 4.5 °C -2.4 °C
6 h 2.0 °C -1.25 °C/h

Practical consequence: a protection duration cannot be scaled up or down by simple proportion. Doubling the temperature gap does not mechanically halve the duration, and extrapolating a 6 hour curve to 24 hours is meaningless.

Damping: the cover filters ambient swings

Beyond total duration, a passive cover smooths out spikes. Two observations from the tests:

  • Summer chamber: air cycles between 45.4 °C and 51.5 °C every hour, a 6 °C swing. Product temperature rises steadily at roughly 0.8 °C per hour, with no visible oscillation.
  • Winter chamber: at 4 h 40 into the test, air jumps from -13.5 °C to -2.1 °C, 11.4 °C in twenty minutes. The product moves from 4.2 °C to 3.8 °C, then 3.9 °C. Effectively no response.

This is what an anti-spike protection is expected to deliver: tarmac transfers, dock door openings and cold chain interruptions lasting tens of minutes get absorbed.

How to qualify a thermal cover: the METTCOVER approach

The method used in both reports is reproducible and gives a fair basis for comparing suppliers.

1. Define the product profile

Here, 15 °C to 25 °C, matching controlled room temperature storage. The profile sets the out of range thresholds, and therefore the pass criterion.

2. Build worst case ambient profiles

Three profiles were used:

  • Hot chamber: 45 °C setpoint, measured average air 48.32 °C, maximum 51.50 °C, MKT 49.70 °C, over 19 hours.
  • Direct sunlight (India, summer): average air 41.66 °C, maximum 44.10 °C, over 8 hours.
  • Cold chamber: -12 °C setpoint, measured average air -11.9 °C, minimum -13.6 °C, over 6 hours.

3. Condition the load

12 hours of stabilisation before the test in both protocols. Without conditioning, the measurement captures the product reaching equilibrium rather than the performance of the cover.

4. Instrument the hot and cold spots

The winter test used 7 calibrated temperature data loggers (top left and right, centre left and right, bottom left and right, plus a probe sensor for ambient air), each identified by serial number. The summer test added two surface measurements, on the outer and inner face of the cover.

Qualification always reports the worst position, never the average. In the winter test, the bottom left corner leaves the range 55 minutes into the run, while the top right corner is still at 17.9 °C. Publishing the average of six sensors would overstate the performance.

5. Record at a fixed interval and compute the metrics

5 minute intervals in winter, 60 minutes in summer. The computed metrics are:

  • ATRR (Average Temperature Raise Rate): average time needed to gain 1 °C, in min/°C.
  • ATDR (Average Temperature Drop Rate): the equivalent for losing 1 °C.
  • Time inside the product range, per sensor position.
  • MKT, which weights thermal exposure according to its kinetic effect on the product. Calculation detail in our article on mean kinetic temperature.

6. Document metrological traceability

Both reports include calibration certificates for the loggers and for the climate chamber. The chamber certificate references the ITS-90 scale with a stated uncertainty at k=2 (roughly 95 % confidence). Without that chain, the figures do not stand up in an audit, in particular against GDP requirements for pharmaceutical distribution.

METQ test results

METQ qualification results in hot chamber, direct sunlight and extreme winter conditions
Test Ambient Load Time inside 15/25 °C Average rate
Hot chamber 48.32 °C average air 8.5 % 11 h (bottom and centre corners), 9 h (top corner) ATRR 65.70 min/°C
Direct sunlight 41.66 °C average air 8.5 % 5 h (bottom and centre corners), 3 h (top corner) ATRR 38.91 min/°C
Extreme winter -11.9 °C average air 5.4 % 55 min above 15 °C ATDR 19.5 min/°C
One clarification: the tests were run on the METQ grade with different loads (8.5 % against 5.4 %). The three rows are therefore not directly comparable with one another. They describe three exposures, not a ranking.

The counterintuitive result: sunlight is harsher than the hot chamber

Air was cooler under direct sunlight (41.66 °C) than in the chamber (48.32 °C), yet protection lasted half as long. The measured surface temperatures explain it:

Thermal cover surface temperatures in hot chamber versus direct solar radiation
Measurement Hot chamber Direct sunlight
Average ambient air 48.32 °C 41.66 °C
Cover outer surface 43.97 °C 47.78 °C
Cover inner surface 36.94 °C 55.38 °C
Peak inner surface 40.30 °C 64.20 °C

In the chamber, the inner face stays 11 °C below the air: the cover is doing its job as a convective barrier. Under direct radiation, the inner face rises above the outer face and peaks at 64.20 °C, because the outer wall absorbs the solar flux while being partly cooled by moving air, whereas the inner volume is confined.

What this means for sizing: on a tarmac, air temperature is not the right input variable. Radiative load drives the outcome. A calculation based on weather forecasts alone will systematically understate real exposure.

What these results do not say

Both reports state it explicitly: the tests run in a controlled environment, and the manufacturer accepts no liability for excursions occurring during live shipments. Chamber qualification does not replace field qualification.

Three systematic gaps between laboratory and shipment:

  • Vibration and handling open or displace covers that are not properly secured.
  • Real profiles alternate between pressurised hold, tarmac and warehouse, with harsher transitions than a fixed setpoint.
  • Humidity, rain and wind change surface exchanges. METQ shows 919 cm H2O water pressure resistance (ISO 811:2018) and a moisture vapour transmission rate of 0.0156 g/m²/day (ASTM E96), but those values characterise the material, not the closed shipping unit.

The recommended approach is to instrument the first live shipments with USB temperature data loggers or real-time GPS temperature trackers, then cross check the readings against the qualification data.

FAQ

Does a passive thermal cover keep goods cold without electricity?

Yes, but it never produces cold. It slows the warming of a product that is already at the right temperature. No energy is consumed, and the cover needs no pre-conditioning.

How long does a thermal cover protect a pallet?

From a few hours to more than a day, depending on exposure and load. In the METQ minimum load tests, protection inside the 15/25 °C range lasted 11 hours in a 48 °C chamber, 5 hours in direct sunlight and 55 minutes in a -12 °C chamber. A fuller pallet holds longer.

What does ATRR mean?

Average Temperature Raise Rate: the average time, in minutes, for the product to gain 1 °C. An ATRR of 65.70 min/°C means roughly 66 minutes per degree gained. The higher the value, the better the insulation under the tested conditions.

Why test with a minimum load?

Because a lightly loaded pallet has little thermal inertia and represents the worst case. Results obtained at 5.4 % or 8.5 % load set a performance floor: real shipments, being fuller, will do better.

Why can the inner face of the cover be hotter than the outer face?

Under direct solar radiation only. The outer wall absorbs the solar flux and is partly cooled by convection with moving air, while the inner face re-emits into a confined volume with no way to release the heat. METQ measurements give 47.78 °C average outside against 55.38 °C inside.

Is a bottom base required with the cover?

Yes. Both METQ tests ran with cover plus bottom base. Without closure underneath, air circulates through the pallet and short circuits the insulation, which invalidates the stated hold durations.

Need to size thermal protection for a specific lane? Send us your product profile, exposure duration and pallet fill rate, and we will identify the right grade and the matching qualification data.

Request technical advice

See also: our thermal protection range and insulation kits for containers.

Common Mistakes to Avoid When Using Temperature Data Loggers in the Cold Chain

Common Mistakes to Avoid When Using Temperature Data Loggers in the Cold Chain

In the cold chain industry, where sensitive products such as food, pharmaceuticals, and chemicals are transported and stored at strictly controlled temperatures, the use of temperature data loggers is essential. These devices allow real-time monitoring of temperature conditions, ensuring product quality throughout their journey. However, despite their power, errors can occur that compromise the effectiveness of temperature monitoring and, consequently, product safety. Here are the common mistakes to avoid.

1. Using Non-Calibrated Data Loggers or Those Without a Calibration Certificate

One of the most serious mistakes in using temperature data loggers is failing to use calibrated or certified devices. Data loggers that are not properly calibrated or lack a calibration certificate can provide erroneous data, which can skew the entire cold chain control process. This is especially true for lower-quality data loggers, often low-cost models, which do not guarantee the accuracy required for sensitive products such as medicines or food. Using these devices can lead to serious consequences in the event of an audit or regulatory check.

2. Failing to Start the Temperature Data Logger Correctly

Incorrectly starting the temperature data logger before use is a critical mistake. While many modern data loggers are easy to start by pressing a “start” button, some devices may display a fault signal at startup that can go unnoticed if the user is not trained to recognize it. It is essential to provide clear instructions to ensure the logger is working properly before transport begins. Neglecting this step can compromise the reliability of the collected data, particularly if the logger does not start recording or encounters an undetected issue.

3. Not Checking the Settings and Internal Clock of the Data Logger

Forgetting to check the initial settings and internal clock of the data logger can cause major errors in the collected data. If the internal clock of the data logger is incorrectly set or if the configuration does not align with the specific transport requirements, this can distort temperature recording and make accurate data analysis difficult. It is imperative to ensure that the settings and internal clock are properly checked and adjusted before starting the recording.

4. Incorrect Placement of the Temperature Data Logger

The placement of the temperature data logger plays a crucial role in the accuracy of the collected data. Placing the logger in a poorly ventilated area, near a heat source, or in a location isolated from the product can result in erroneous readings, distorting the representation of the temperature conditions experienced by the products. Therefore, it is essential to strategically place the logger so that it measures temperature conditions that are representative of the transport or storage environment, ideally at the center of the product lot.

5. Failing to Link the Data Logger’s Serial Number with the Shipment or Lot Identification

Not establishing a clear link between the serial number of the data logger and the identification of the shipment or product lot is a commonly overlooked mistake, yet it can make traceability difficult in the event of an inspection. For optimal cold chain management, it is essential to associate each data logger with a specific shipment or lot, thus facilitating the retrieval of relevant data and ensuring transparency during audits. Complete traceability ensures that temperature data can be linked to specific products, guaranteeing their safety and compliance.

6. Not Using a Data Storage System for Future Audits

Single-use temperature data loggers are designed to store critical data during transport, but often, an effective system for retrieving this information post-shipment is neglected. Failing to retain or improperly storing the data can pose a problem during audits or compliance checks. It is crucial to quickly transfer the collected data to a secure storage system, where it can be accessed years after transport if necessary.

7. Not Considering the Storage Conditions of Data Loggers Before Use

A commonly overlooked error is storing data loggers in inappropriate conditions before use. For example, failing to consider that extreme temperatures can damage the batteries and affect the performance of the loggers. It is essential to store the loggers in a room-temperature environment and allow them to stabilize before starting the data recording. If the logger is too cold, it should stabilize to ambient temperature before beginning data recording. Additionally, it is recommended to transport the loggers in an insulated box, rather than in a pocket or by hand, as this could heat up the device and skew the readings.

8. Not Indicating the Location of the Data Loggers in the Shipment

Another common mistake is not clearly indicating the location of the data loggers in the shipment. If the logger is placed inside a complete box or in a difficult-to-locate spot, it may be challenging for the recipient to quickly find it upon arrival, delaying access to the data. Therefore, it is crucial to specify the logger’s location in the shipping documents or even mark the location on the packaging. This ensures that the logger can be quickly located, facilitating the retrieval of the data.

Conclusion

Using temperature data loggers in the cold chain is essential to ensure the safety of transported products, but common mistakes can compromise their effectiveness. By choosing calibrated and certified data loggers, starting devices correctly, verifying their settings, placing the loggers in the right locations, and ensuring complete traceability, businesses can avoid costly errors. Furthermore, it is crucial to properly store the data and adhere to the recommended storage conditions for the loggers to optimize temperature monitoring. By avoiding these mistakes, businesses can ensure the safety of their products, improve logistical performance, comply with regulations, and strengthen customer trust.
5 Essential Tips for Efficient Temperature-Controlled Shipments

5 Essential Tips for Efficient Temperature-Controlled Shipments

Organizing a temperature-controlled shipment is a complex operation, and managing data loggers can often feel like an unnecessary burden. However, ensuring the safety and quality of temperature-sensitive products during transport is paramount. To help streamline this process and avoid potential complications, here are five essential tips to optimize your temperature-controlled shipments and effectively manage your temperature data loggers.

1) Notify Your Recipient

While it may seem obvious, always inform your recipient about the required storage temperature range of your products. This ensures they are fully aware of the specific conditions needed for proper storage and handling upon arrival.

Additionally, make sure they are aware of the presence of a temperature data logger in your shipment. It’s important to confirm that the recipient can easily read the data logger as soon as they receive the shipment and quickly send you the temperature data.

Don’t fall into the trap of assuming all USB temperature data loggers are universally readable. Many companies, due to security concerns, no longer allow the use of removable USB drives. This oversight can lead to a return of your shipment at your expense. Confirm that the recipient is equipped to handle your data logger before shipping.

Finally, ensure that both parties are in agreement on the procedure in case of a temperature excursion, as well as the responsibilities involved in addressing such situations.

2) Position Your Data Logger Closely to the Product

Place your temperature data logger as close as possible to the product, ideally at the center of the packaging. Smaller-sized data loggers are perfect for this, as they can easily fit within the core of the shipping boxes.

Why is this important? Temperature fluctuations that affect the outer layers of packaging often don’t impact the product itself due to insulation from the surrounding materials. However, if the data logger is placed on the exterior of the package, it will directly experience temperature changes, which can lead to false alarms and temperature excursion reports.

If you’re using passive cold chain packaging (e.g., isothermal boxes), ensure the data logger isn’t in direct contact with the cold source. This could cause an extreme excursion in temperature and skew the results.

3) Indicate the Data Logger’s Position Clearly

Make sure that your temperature data logger is accompanied by a clear positioning label that specifies its exact location within the shipment. This will help the recipient easily locate it upon arrival.

In logistics, particularly with co-loading shipments, your package may be mixed in with many others, making it harder to track the data logger. Some logistics professionals have reported that finding a single data logger in a large truck can take up to two days—if it’s even located at all.

During this time, the shipment may be put in quarantine, or worse, the products may need to be reanalyzed due to missing information. This can be particularly detrimental if the products are urgently needed, such as in pharmaceutical shipments where patients may be waiting.

4) Establish Robust Traceability Between Your Data Logger and Products

It’s crucial that you can provide proof that the temperature data you report during audits corresponds accurately to the products being shipped. This means creating a link between each data logger and its associated product batch.

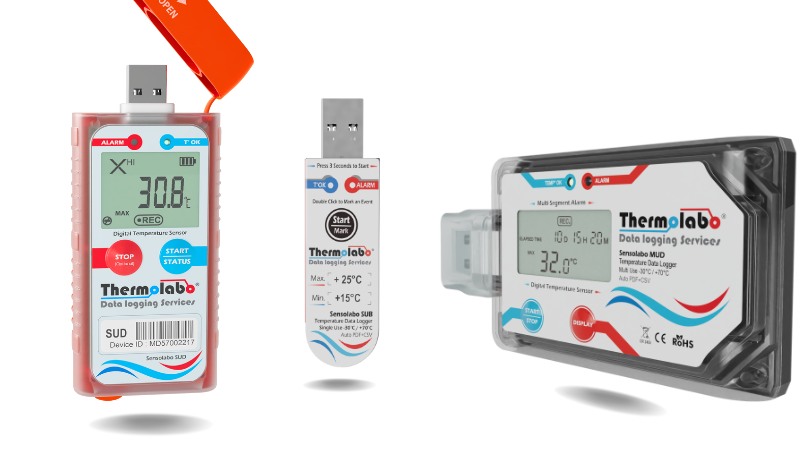
Unfortunately, many shipments rely on manually recorded serial numbers for their data loggers, which can result in mistakes due to illegibility, incorrect entries, or incomplete information. To avoid this, use a fully digital system, such as Sensolabo®, which allows for secure and easy tracking through barcode scanning.

By linking the barcode of the pallet or box with the data logger, you can effortlessly maintain traceability, ensuring you have complete and accurate records for each shipment.

5) Ensure Your Data Loggers Are Functioning Properly Before Shipping

Before shipping, always check that your data loggers are fully functional. Use data loggers equipped with visible indicators, such as LED lights, to confirm that they are activated and recording as intended.

Also, pay close attention to the calibration and expiration dates of your temperature data loggers to ensure they will remain accurate throughout the transport process. As the battery or power source ages, it can lose performance, which might lead to inaccurate temperature readings during the shipment.

It’s also important to consider that data loggers—like any electronic device—can malfunction due to extreme conditions during transport, or even suffer damage through mishandling. To mitigate the risk of lost data, it’s advisable to use multiple data loggers for shipments containing several pallets or boxes. This ensures that, in the event of a failure, you won’t be left without vital temperature data upon arrival.


Conclusion

Effectively managing temperature-controlled shipments requires careful attention to detail, especially when it comes to handling data loggers. By following these five tips—informing your recipient, positioning your data logger correctly, establishing clear traceability, ensuring proper functionality, and using multiple loggers for added security—you can avoid common pitfalls and ensure the safe, compliant, and efficient transport of temperature-sensitive products.

By implementing these strategies, you can streamline your cold chain processes, reduce the risk of costly errors, and ultimately safeguard the quality and safety of your products.